AssemblyAI has made it much easier to distinguish speakers and determine what they spoke in a conversation, resulting in:
13% more accurate transcript than previous versions.
85.4% reduction in speaker count errors.
5 new languages (total 16 supported languages).
A demo is shown below.
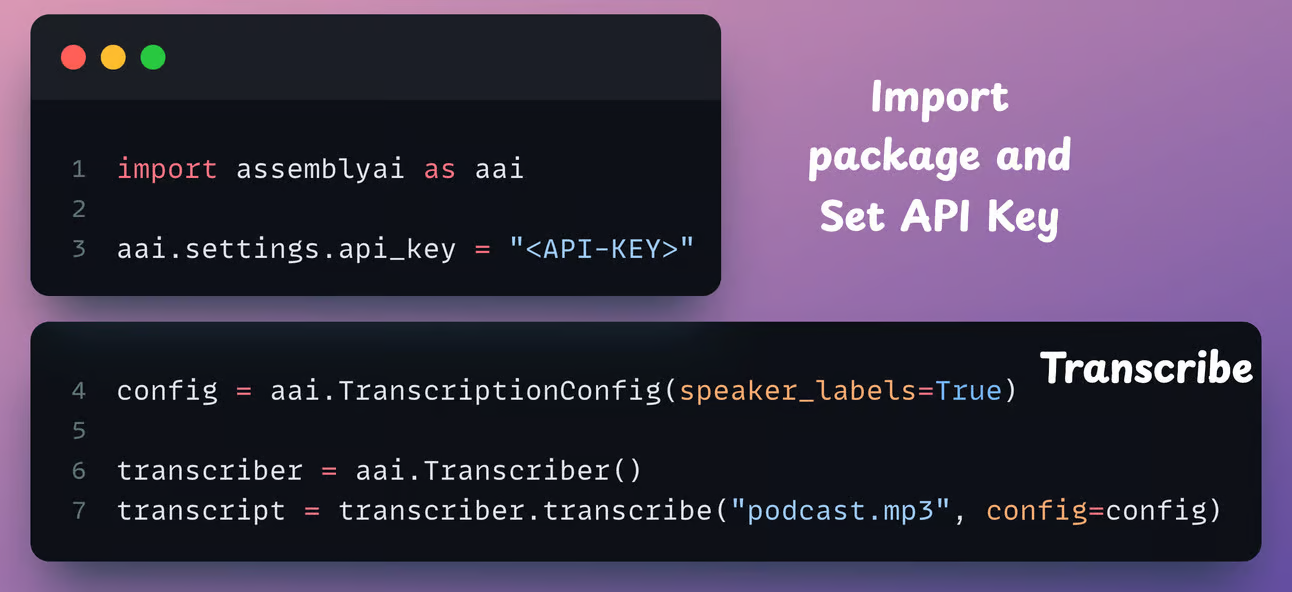
First, import the package, set the API key, and transcribe the file while setting speaker_labels parameter to True:
Next, print the speaker labels:
AssemblyAI’s speech-to-text models rank top across all major industry benchmarks. You can transcribe 1 hour of audio in ~35 seconds at an industry-leading accuracy of 92.5% (for English).
Histograms are quite common in data analysis and visualization. Yet, they can be highly misleading at times.
Why?
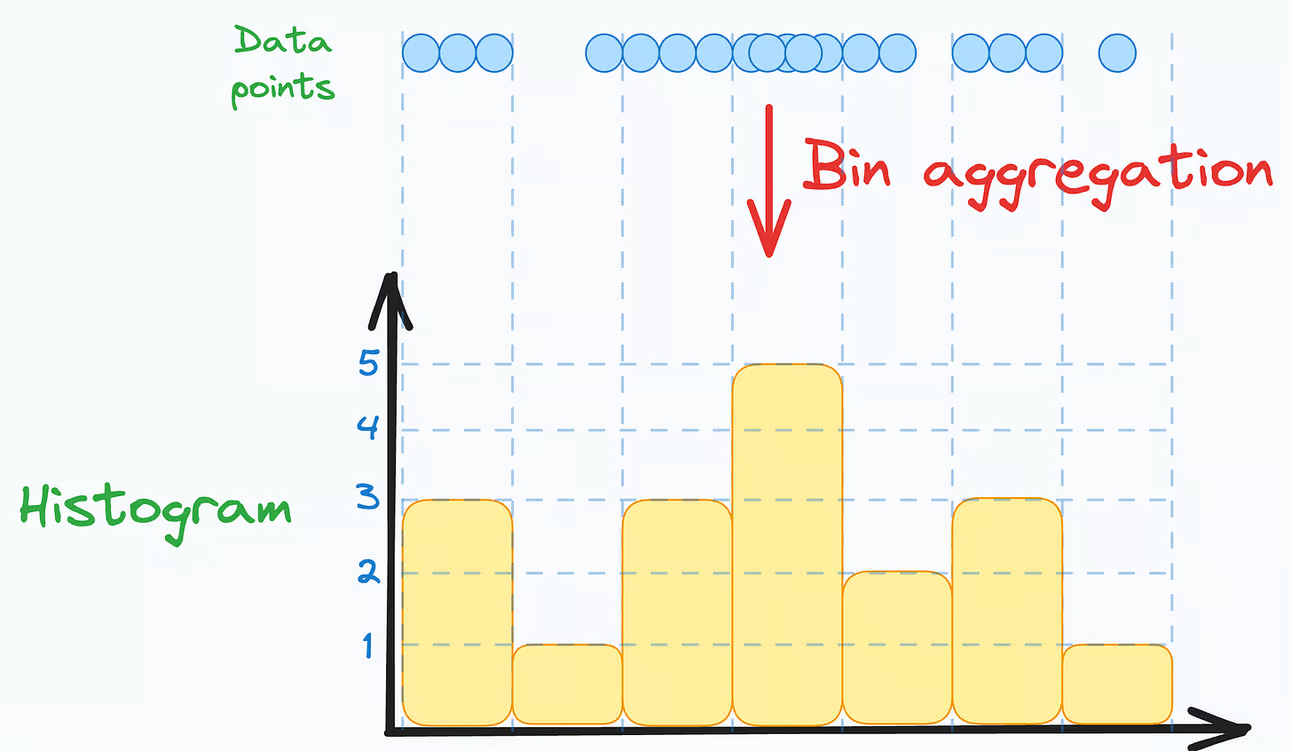
To begin, a histogram represents an aggregation of one-dimensional data points based on a specific bin width:
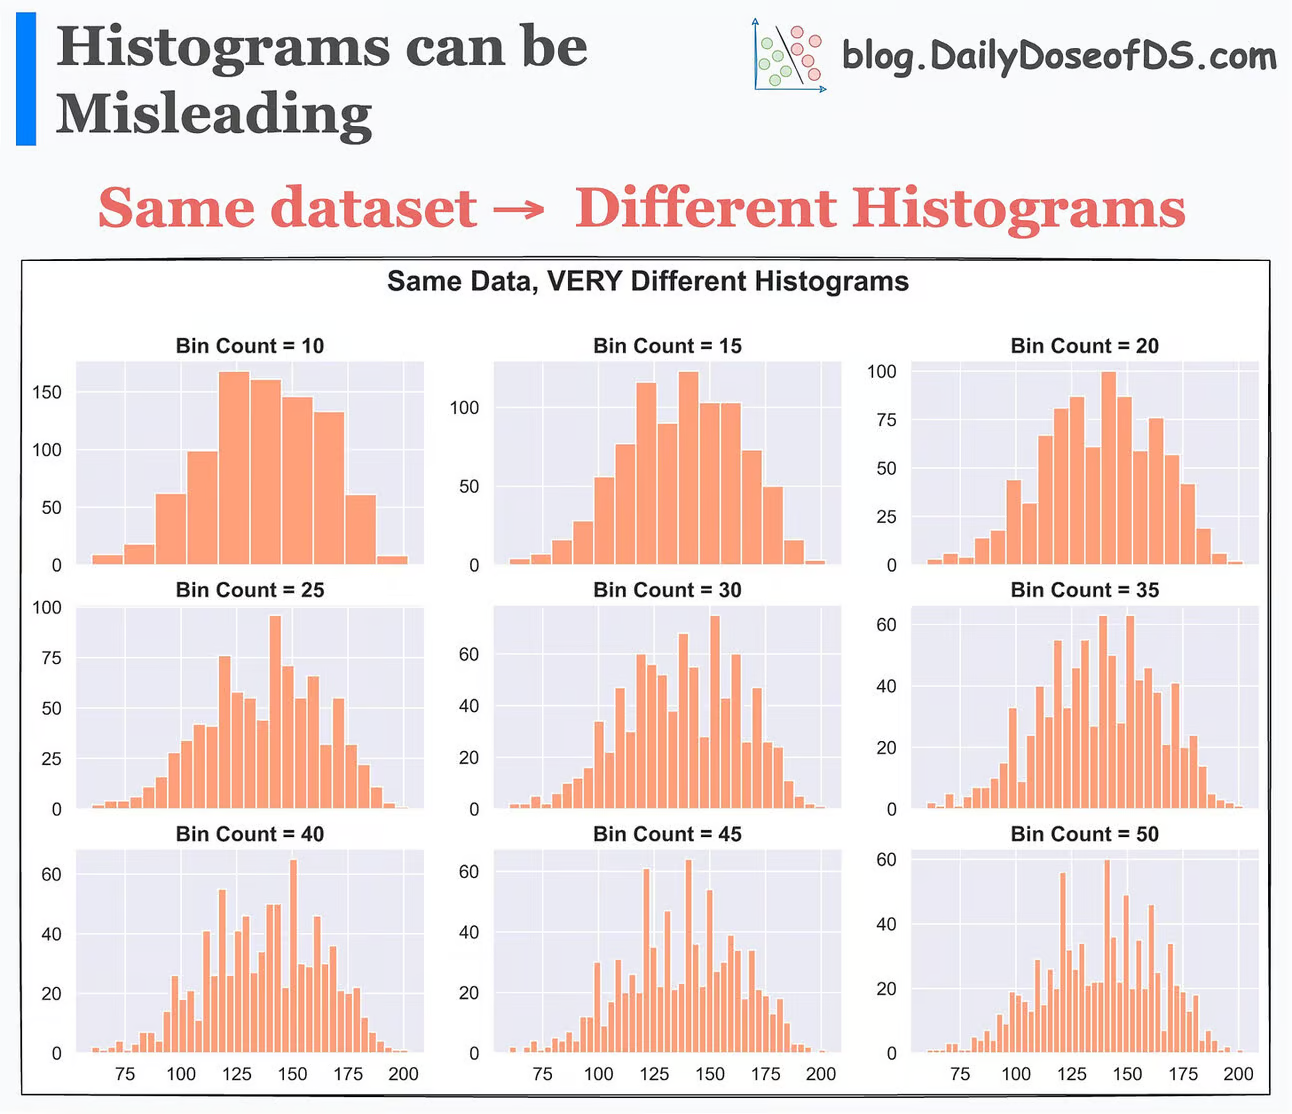
This means that setting different bin widths on the same dataset can generate entirely different histograms.
This is evident from the image below:
Altering the bin width changes the type of histogram created
As shown above, each histogram conveys a different story, even though the underlying data is the same.
Thus, solely looking at a histogram to understand the data distribution may lead to incorrect or misleading conclusions.
Here, the takeaway is not that histograms should not be used. Instead, it is that Whenever you generate any summary statistic, you lose essential information.
In our case, every bin of a histogram also represents a summary statistic — an aggregated count.
Histograms depict a summary statistic
And whenever you generate any summary statistic, you lose essential information.
Thus, it is always important to look at the underlying data distribution.
For instance, to understand the data distribution, I prefer a violin (or KDE) plot. This gives me better clarity of data distribution over a histogram.
Left: KDE plot; Right: Violin plot
Visualizing density provides more information and clarity about the data distribution than a histogram.
👉 Over to you: What other measures do you take when using summary statistics?
Consider two functions that take a decent amount of time to execute and return a boolean:
long_function
longer_function
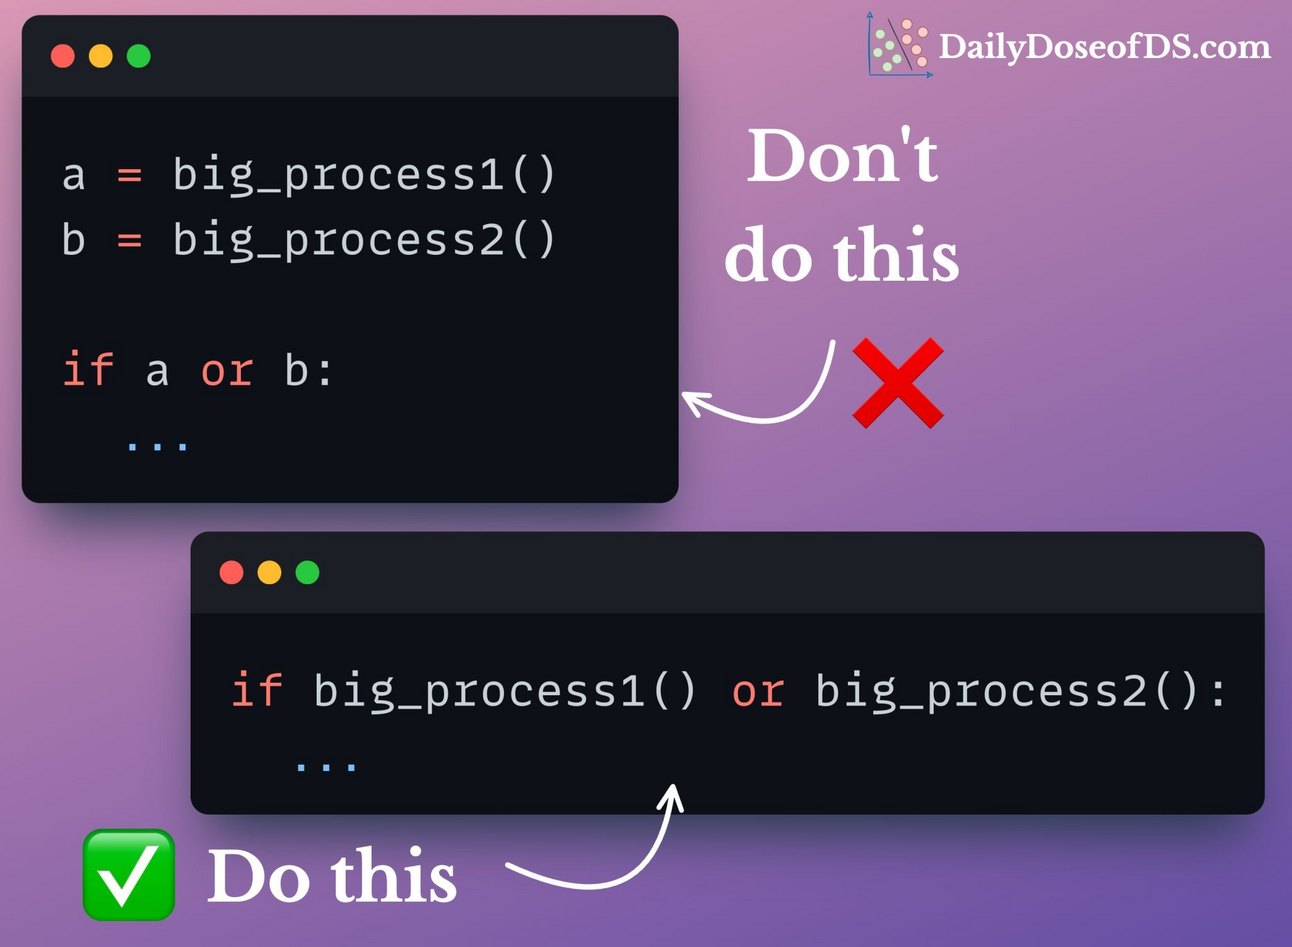
We want to run a conditional if one of them returns True. An optimal way to do this is by shifting the function call in the if statements.
This way, if long_process() returns True, longer_process() will not be executed because of the way OR works. This reduces run-time.
A similar optimization can be achieved if we intend to use AND.
THAT'S A WRAP
SPONSOR US
ADVERTISE TO 450k+ Data Professionals
Our newsletter puts your products and services directly in front of an audience that matters — thousands of leaders, senior data scientists, machine learning engineers, data analysts, etc., around the world.
Master Full-stack AI Engineering In today's newsletter: An Open-Source Autonomous BI Agent. A Memory-efficient technique to train large models. Types of memory in AI Agents. TODAY'S ISSUE Open-source An Open-Source Autonomous BI Agent MindsDB just open-sourced Anton, an autonomous BI agent that turns plain-language questions into full dashboards. You ask something like “Show me NVIDIA’s profit margins,” and Anton handles everything: figuring out the right data source, writing and executing...
Master Full-stack AI Engineering In today's newsletter: Is AI actually saving your engineering team time? Anatomy of the .claude/ folder. TODAY'S ISSUE together with postman Is AI actually saving your engineering team time? Most teams have adopted AI in some form, but the gap between “using AI” and “getting measurable ROI from AI” is larger than people realize. Postman released a cost savings analysis that looks at six common API development workflows and benchmarks the actual time and cost...
Master full-stack AI Engineering In today's newsletter: DailyDoseofDS is now on Instagram! MCP & Skills for AI agents. [Hands-on] Building an open NotebookLM clone! TODAY'S ISSUE AI engineering DailyDoseofDS is now on Instagram! This newsletter regularly breaks down RAG architectures, AI agents, LLM internals, and everything in between. Now we’re bringing all of that to Instagram too, in a format that’s quick to consume and hard to ignore. We’re already 240 posts deep with content on RAG vs...